Game analytics
CS 7280: Special Topics in Information Visualization
Homework 5 - Part 1: Game Analytics
Dataset
- adjacenecy-matrix.csv : Data to represent the graph
- edge-list.csv : Data to represent the edges in the graph
- game-log.csv : The player’s actions (in chronological order)
Interactive Visualizations
I have used a Force - Directed Graph to represent the players’ steps in the game. The circles represent the nodes and the edges represent the paths which the player selects. The marker end of the edge helps to identify the direction of the edge. I have used different stroke format for the edges to encode the player step (e.g. solid green edge for “move”, dashed black edge for “mark edge” and solid blue edge for “unmark edge”). Additionally, to display the chronological order of steps taken, the edges have been marked with the order number in which the step was taken.
Link to Visualization: Game Visualization
(If unable to view the visualization in Google Chrome, please enable “Load Unsafe Scripts” in the URL bar.)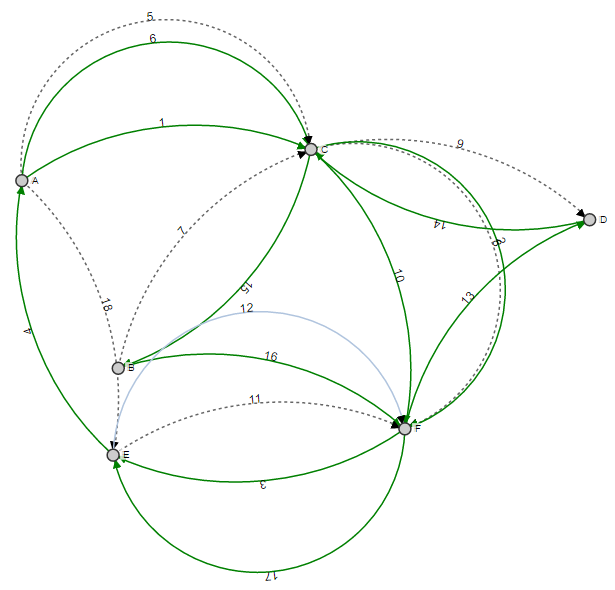
Design Decisions The visualization is interactive as we can move the nodes around to visualize the edges clearly as well as the graph rearranges itself after any interaction. A user can take multiple paths from one node to another including different steps so a dynamic visualization is a better choice here as it provides a way to change the orientation of the nodes to view overlapping edges clearly. I used numbers as labels on the edges to represent the chronological order as it helps to bring information closer to the visualization while keeping the clutter in the graph to minimum. Usage of different strokes for the edges eliminates the need of labeling the edges with step type without losing any data. I chose to represent the edges as an arc instead of straight line because there are multiple edges between some nodes (e.g. node A and node C), and arcs with different radius solves the issue of overlapping edges.
References Mobile Patent Suits Force Directed Graph with Multiple Edges
Source Code of Interactive Visualization: HW 5 : Game Analytics
Author: Harshali Singh