Brushing and linking
CS 7280: Special Topics in Information Visualization
Homework 4 - Part 2: Brushing and Linking
The idea of linking and brushing is to combine different visualization methods to overcome the shortcomings of single techniques. Interactive changes made in one visualization are automatically reflected in the other visualizations. Two of these several techniques are Brushing and Linking.
Brushing refers to several interaction techniques that allow the user to select a subset of data in a visualization. By Linking, we mean showing how a point, or set of points, behaves in each of the plots. This is accomplished by highlighting these points in some fashion.
Dataset
As an international student living in US, the increase and fall of the Indian Rupee to US Dollar Exchange Rate is of utmost importance to me due to financial reasons. The rate helps me make a very important decision regarding when to transfer money to or from my parents in India. Therefore, I have chosen the dataset of INR - USD Conversion rate for the past 2 years (Sept 2014 - Sept 2016), i.e. since I moved to US for my higher studies.
Data Source: USD/INR Historical Data
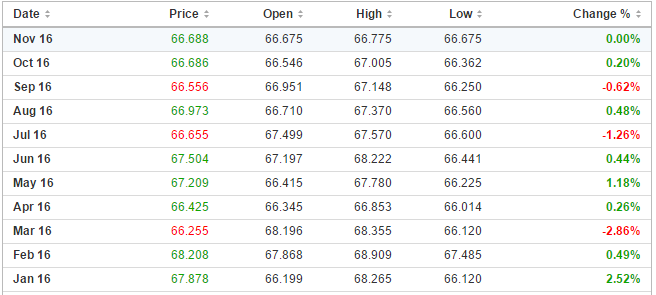
Dataset snapshot:

Cleaning Dataset
The inital cleaning steps involved selecting the date and the price column from the dataset. Then, the dataset was filtered to capture data between Sept 2014 - Sept 2016. The format of the date column was changed to Date and the price column was changed to numeric. Preliminary exploration of the data was performed in Excel and from the below chart, we can understand how US Dollar has increasingly become expensive compared to Indian Rupee over a period of 24 months.

Interactive Visualizations
An interactive visualization using ScatterPlot

Brush and Zoom: USD/INR Historical Data
An interactive visualization using Brush and Zoom technique

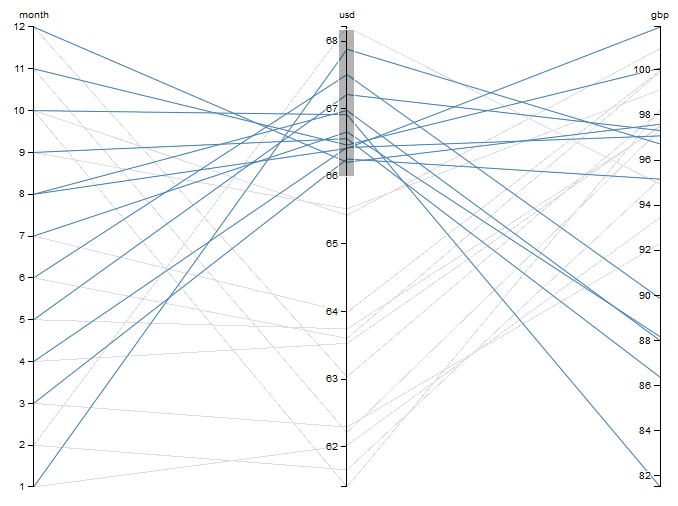
An interactive visualization using Parallel coordinates

Source Code of Interactive Visualizations: Brushing and Linking
Authors: Harshali Singh, Vishal Mehta, Bhavin Vora